


This web page documents an informal analysis of 10 2000mAh Powerizer brand NiMH rechargeable batteries.
Procedure
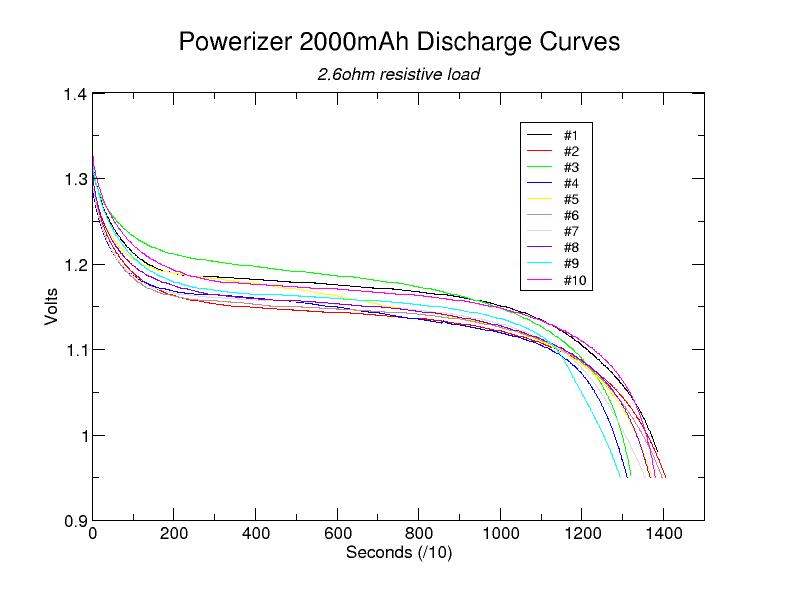
All batteries were first charged fully in the V-6988 smart charger and left to trickle charge for 2 days before testing began. Tests involved discharging each battery through a (measured) 2.6ohm resistive load while monitoring battery voltage at 10 second intervals via multimeter connected to a computer via serial port for data logging. Once a cell fell below 0.95 Volts, the cell was considered "discharged" and was placed back in the charger while another battery was tested.
0.95V was chosen as the cutoff point because that represents a decrease of 1/e, or roughly 37%, of the initial voltage of a 1.5V cell. It is not unreasonable to expect a battery-operated device to fail if the voltage falls below this point.
If we assume the average cell voltage through the discharge cycle is about 1.15V (see graphs), then a 2.6ohm load gives us a discharge current of, on average, 0.44 Amps. For a 2000 mAh battery, this is somewhere between C/4 and C/5. Standard industry practice is to measure at a discharge rate of C/10 (around 0.2A for these batteries). Higher discharge currents will result in diminished measured capacities.
Results
Actual data files are available here
As this graph shows, when fully-charged, all ten cells displayed similar discharge curves. No single cell stood out as "abnormal". Based on these data files, it is straightforward to compute the amount of charge transferred and, thus, the battery's capacity, at least down to 0.95V. A simple program to do this can be found here.
Remarks
Capacity appears to be significantly below the claimed 2000 mAh. Judging from the discharge graphs, voltage begins dropping rapidly once the cell potential falls below 1V so I do not suspect that extending measurements to include lower voltages (say down to 0.1V) would have much impact on the capacity measurement. In addition, such deep discharging might possibly be harmful to the batteries. It is unknown how much of an effect the higher discharge current had on the results (I do not have time to run these tests at C/10).
Another thing to notice is that for each cell, the voltage throughout the "flat" part of the discharge graph is slightly below 1.2V. I believe some other manufacturers advertise their batteries maintain a voltage above 1.2V.
Though not reflected in the graph, three anomalous batteries (#5, #7 and #10) were detected during subsequent recharging. Each of these cells caused the charger to prematurely indicate "full charge," in some cases within 30 minutes. Now, keep in mind that the V-6988 smart charger is a slow charger and should require at minimum 8-12 hours to fully recharge one of these batteries. Please note that, when fully-charged, these three batteries do in fact exhibit "normal" discharge curves.
At this point, I am surprised the charger successfully charged these three batteries the first time. I'm writing that off to luck. Subsequently, I've found that power-cycling the charger itself will cause the charger to fully-charge these batteries. In effect, this causes the charger to charge these batteries twice and I suspect this is sufficient to "jump" over the false voltage drop that caused the charger to think the cycle was finished. That is what I did to perform the self-discharge tests below.
I have been informed that if a NiMH cell sits discharged for too long, it can build up an internal resistance and this resistance causes the charger to prematurely detect the voltage drop indicative of a fully-charged battery. This person speculates that the cell can be "recovered" by performing a few discharge cycles at a much higher current (C/1...or around 2A in this case). I will try this soon.
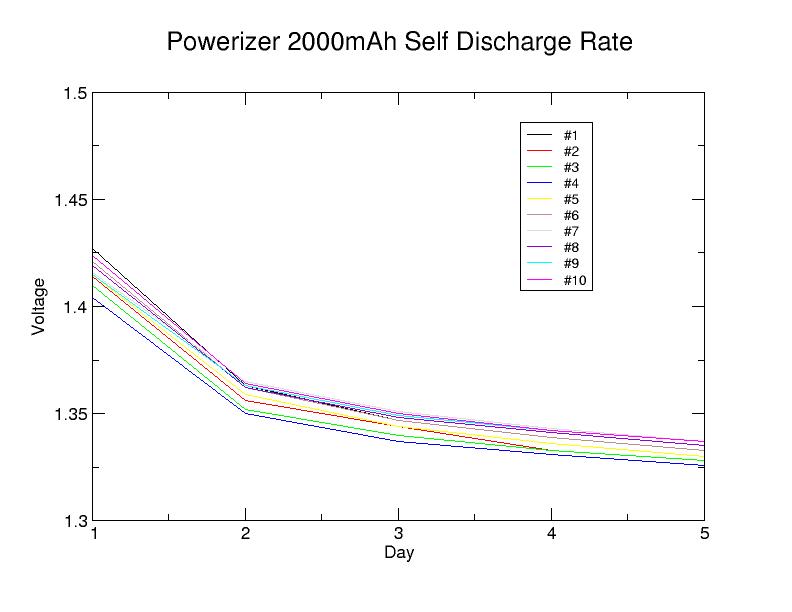
The second test was to see how quickly these NiMH batteries self-discharged. All NiMH batteries will self-discharge. The purpose of this test was to verify that the discharge rate was not "abnormally" high.
Procedure
As with the capacity measurement tests above, all cells were fully-charged prior to the test. Voltage measurements were manually recorded once per day at roughly 24 hour intervals +/- 30 minutes. The same battery holder from the discharge tests was used here and voltage was allowed to stabilize for 10 seconds before recording the value. Tests were conducted for 5 days (thus, 5 measurements per cell).
Results
Actual self discharge data file is available here
Remarks
Obviously, 5 days is too short to confirm the overall self-discharge characteristics of a battery but does show that no cell has an abnormally high discharge rate. As the plot suggests, after the second day, the voltage drop appears to have stabilized at around 0.5 percent per day. Whether this rate holds for the remainder of the self-discharge period is an open question.
Okay, what does it all mean? These batteries are selling for around $1/each in bulk. A 2000mAh battery for $1 would be an outstanding deal. Unfortunately, my measurements suggest that the cells are actually between 1600 mAh and 1700 mAh, at least when discharged at a C/4 to C/5 rate. Is $1 for say, a 1650mAh NiMH battery a good deal? Probably.
The original discharge curve measurements were performed in early November, 2003. These measurements were repeated in late October/early November, 2004. I attempted to precisely duplicate the conditions of the first set of measurements: same charger, same charging method, same measurement tools. Unfortunately, I was unable to duplicate the 2.6ohm resistance of the original measurement. The new measurements were performed using a 2.7ohm resistance. This small deviation should have an insignificant impact on the results.
Results

Actual data files are available here
At first glance, the discharge curves appear to be largely unchanged from 2003. As we'll see, this is not quite true. Also, you'll note that battery #10 is no longer present in the results. This battery failed shortly before the new measurements were performed.
Based on this data, we can compute each battery's capacity using the same method as before.
| Battery | 2003 mAH | 2004 mAH |
| 1 | 1716.38 | 1592.59 |
| 2 | 1697.73 | 1640.84 |
| 3 | 1651.47 | 1516.10 |
| 4 | 1592.75 | 1527.44 |
| 5 | 1677.94 | 1401.53 |
| 6 | 1690.13 | 1258.31 |
| 7 | 1647.17 | 1412.17 |
| 8 | 1666.17 | 1312.54 |
| 9 | 1588.85 | 1311.11 |
| 10 | 1709.10 | N/A |
Remarks
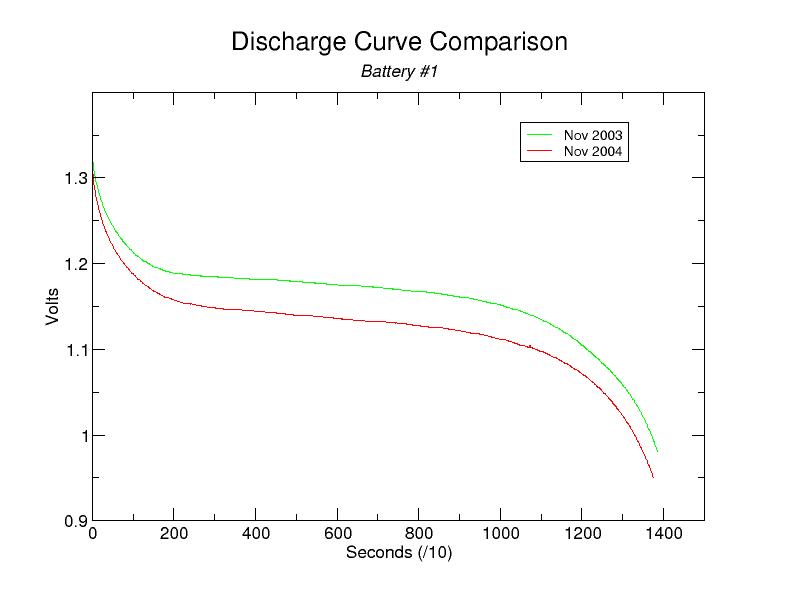
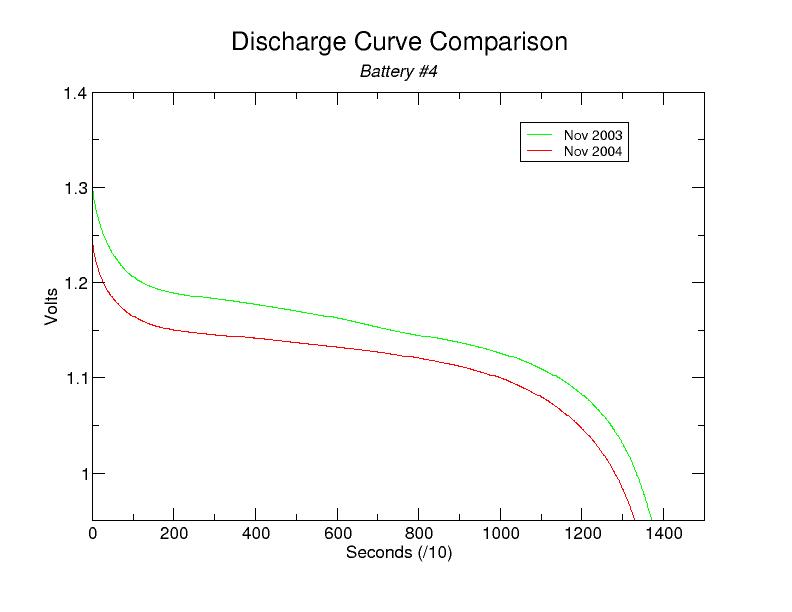
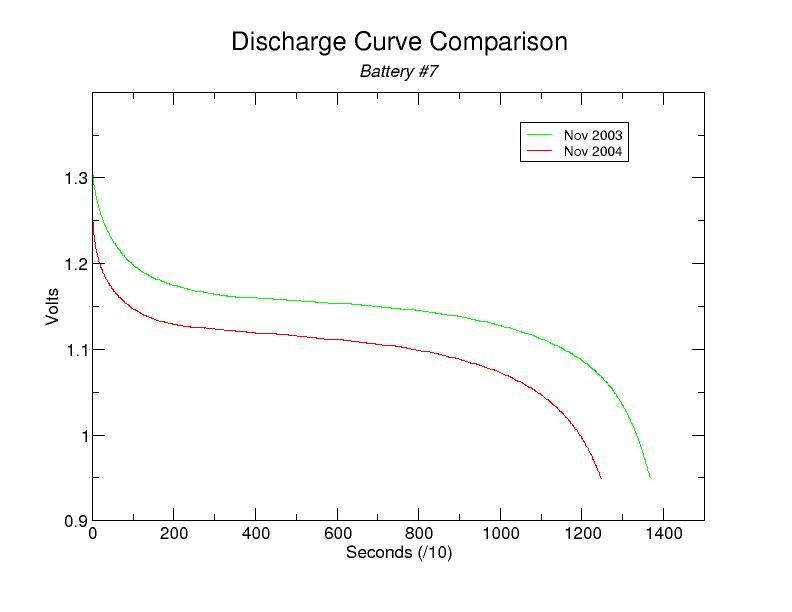
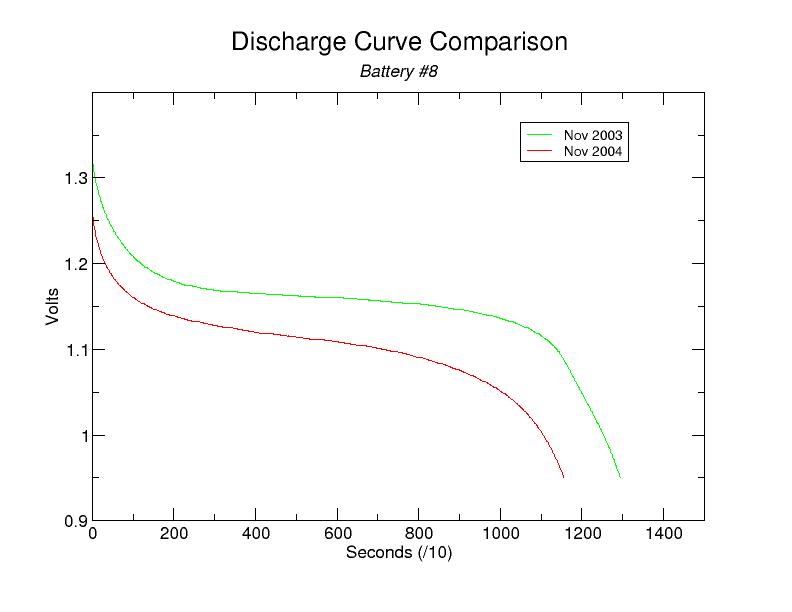
Capacity has diminished for each battery though the percentage decline is inconsistent. Keep in mind that the discharge resistances aren't quite the same (2.6 Ohm vs 2.7 Ohm, respectively) though I do not suspect it had any tangible impact on the results. Also, I am unable to explain the general decline in capacity as battery number increases. Presumably this is merely coincidental.
To better visualize the decline in capacity per cell, the following are comparisons of the individual discharge curves. You can click on these thumbnails to see the full-size plots.
|
|
|
|
|
|
|
|
|
Okay, a year has passed. One would expect that cell capacity will diminish with time and use and these measurements certainly support that. These cells were used sporadically over the past year. When not in use, they were left on trickle charge (charging at a C/80 rate).
The question becomes: are these cells still usable after a year? This probably depends on the device. Since most of the discharge curves now occur in the 1.0V - 1.1V range, it's not surprising that some devices immediately alert the user of a low battery condition even if the batteries came directly from the charger. My Nikon CP950 camera falls into this category. For those devices, these batteries are no longer useful. For this reason, I cannot recommend Powerizer brand NiMH batteries.
It would be interesting to see if other NiMH brands deteriorate as rapidly as these Powerizer batteries.